Infographics
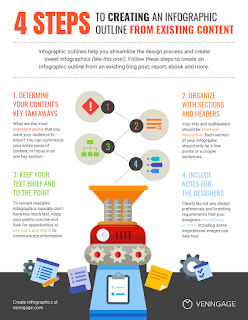
Inforgraphics is a visual tool to display important information that is readily accessible to its viewers. It uses charts, numbers, imagery, and very little text to provide an overview that is easy to understand.
I think this would be a handy tool for the classroom. Previously in my grade 5 social studies class I had the students create infographics that overviewed the key points of the Fur Trade. This allowed them to demonstrate their learning and build their critical thinking skills! The results were really good and were all unique to the students interest in the Fur Trade. Here are 50 great examples for a further look.
Above is an example of one I create. It's not to in depth but it gives a good idea of what can be whipped up in s short time. I used Canva to create mine but I also played around with Piktochart . I'm sure there are other sites available as well to create them. These were just the first two I came across.
Until next time,


I love the idea of using infographics for a unit in the classroom. It's nice because you can adapt it to so many different subjects. You can also adjust the depth of what you are looking for which would be nice depending on the grade level you are teaching. I also think its a great way to create something to hang around your classroom if you are trying to reinforce classroom expectations etc.
ReplyDelete